
 AUD
AUD
 Loading... Please wait...

Recent Posts
NSW is Australian Science’s High Noon Showdown
Posted by on
As we speak, the credibility of the entire Australian scientific community hangs in the balance, especially Australia’s leading epidemiologists and infectious disease experts.
These experts have, in the past 21 months, taken centre stage in Australian scientific and public policy circles as the COVID-19 pandemic has taken over and dominated the Australian national consciousness including all areas of economic and social life.
In particular, these experts have played an instrumental role in formulating scientific and public health advice primarily through epidemiological statistical modelling and forecasting regarding the delta variant outbreak in NSW from June to October of 2021.
As noted in the article, “Australia’s greatest public policy disaster since 1915”[1], Australia’s entire pandemic management response has been based on a critical series of scientific assumptions – principal among them is the primary infection model by which COVID-19 infects and spreads through human populations.
Conventional scientific thinking and the very elementary basis of modern epidemiological knowledge is that viruses and bacteria spread through a human population primarily through a person to person (P-P) infection model.
This belief led to analysis, forecasts and policy recommendations which sought to limit the movement of Australians through policies such as lockdowns, social distancing as well as interstate and international border closures.
Alternatively, dissenting scientists, such as Sir Fred Hoyle, Chandra Wickramasinghe and Ted Steele, believe that while P-P viral infections do occur, the primary infection model, especially during pandemics, are derived from an atmospheric source otherwise known in the scientific literature as ‘miasma’[2].
These scientists believe that miasma provides a more scientifically robust explanation for the observed infection phenomena during the current pandemic which has also been documented in previous pandemics such as the Spanish Flu pandemic of 1918-19 or the European bubonic plague of 1346 ‑1353[3].
In the coming weeks as the Australian state of New South Wales (NSW) emerges from its current lockdown, NSW is likely to provide a critical test as to which group of scientists was more accurate in their analysis of COVID-19 as rates of COVID-19 cases, hospitalisation and ICU admissions are watched closely.
For those scientists and public health officials who believe that P-P is the primary infection model for COVID-19, they emphatically forecast that COVID-19 cases, hospitalisation and ICU admissions will rise in NSW in the coming weeks as people mobility increases, resulting from the removal of lockdown restrictions.
Alternatively, scientists who subscribe to the miasma theory believe that COVID-19 cases, hospitalisation and ICU admissions in NSW are likely to fall as COVID-19 viral loads continue to dissipate in the community after an initial atmospheric viral in fall burst prior to the epidemic outbreak observed during June 2021.
It is without question that if the predictions of conventional epidemiologists and infectious disease experts play out to be wrong in NSW, adhoc new justifications which lack both empirical and/or clinical evidence (such as warmer temperature, higher UV levels, less vitamin D3 deficiency, less sharing of entrained/dormant indoor air, more outdoor breathing/airway flushing or high vaccine coverage) will be offered to explain away why their analyses and forecasts have not played out.
In this situation, it will be critical for the future integrity of science and pandemic management that Australian policy makers reflect on the possibility that the entire scientific establishment may have assumed the wrong primary infection model for COVID-19, despite repeated warnings from dissident scientific research groups.
If this is indeed the case, the scientific, as well as possibly the legal, consequences may be profound, given the extent of public harm which restriction of movement policies have caused millions of Australians, particularly in the states of NSW and Victoria.
NSW Premiers Berejiklian and Perrottet
It is without question that the highest levels of NSW’s political leadership have been influenced both by epidemiologists and infectious disease experts and their scientific advocacy of the P-P infection model as COVID-19’s primary infection transmission mechanism.
In recent weeks, both former NSW Premier Gladys Berejiklian and current NSW Premier Dominic Perrottet have made a series of statements which are consistent with mainstream epidemiological thinking and modelling that COVID-19 cases, hospitalisation and ICU admissions will rise, potentially quite dramatically, as NSW relaxes various lockdown restrictions at double dose vaccination thresholds of 70%, 80% and 90%.
For example, at her press conference of 20 September 2021, former NSW Premier Berejiklian made the following statements (emphasis added):
“October will be the worst month for people who pass away and the people who require intensive care. No matter what is happening in terms of the vaccination rate or anything else, that is the likely scenario.”
“We also have to accept that, once we start reopening, cases will go through the roof, but it won’t matter as much because people will be vaccinated.”
“We need to know that come October there will be weeks when our system will be technically overwhelmed, but the plans are in place.”[4][5]
These expectations were endorsed by NSW Premier Perrottet at his press conference of 9 October 2021[6] where he stated:
“Naturally we will see as NSW opens up, case numbers increase and hospitalisation increase – it is a natural part of opening up.”
Premier Perrottet reiterated these expectations at his press conference of 18 October 2021 when he stated:
“We would think that in the next couple of weeks as mobility increases across the state, as restrictions are lifted, case numbers will increase and that will be a challenge, that will be a challenge for our state, but our health system is very strong and obviously we will expect hospitalisation to increase as well… this is not over, we have a long way to go.”[7]
Epidemiological Forecasts for NSW
Critically, the statements made by NSW Premier’s Berejiklian and Perrottet as documented above are not only derived by mainstream epidemiological theory, but also from specific epidemiological modelling and forecasts, coupled with associated policy advice in which their respective governments received from:
- their own departments and officials such as NSW Health;
- epidemiological and infectious disease academics employed by academic institutions; as well as
- private sector scientific and medical research institutes.
Importantly, many epidemiologists and their emphatic forecasts of rising COVID-19 related cases, hospitalisation and ICU admissions in NSW have not just been provided to the NSW Government through confidential advice but have been stated on the public record across many public platforms.
A range of these emphatic forecasts are detailed in Table 1.
Table 1: Epidemiological Forecasts for NSW
| No | Date | Scientist/Institute | Prediction |
| 1 | 16/07/21 | University of Sydney Centre of Complex Centres | “New modelling has shown that Sydney’s
COVID-19 Delta outbreak is not being adequately controlled by the current
level of social distancing (approximately 40% of compliance) at play.
According to the data, to get on top of the outbreak within a month, social interactions such as shopping must decrease to a tenth of ‘normal social interactions’. Social distancing compliance must double to 80% to see a reduction of cases after one month. At a rate of 70% compliance, the modelling determined positive COVID-19 cases would decrease after two months. The data was produced by the University of Sydney’s Centre for Complex Systems by analysing information about Sydney’s current COVID-19 situation until 13 July.”[8] |
| 2 | 06/09/21 | NSW Health | “The NSW Government is expecting hospitalisations
from COVID-19 to peak at the end of October despite rising vaccination rates.
“NSW Health has released a modelling report which suggests hospitalisations will reach 3,434, with almost 1,000 cases requiring intensive care treatment.”[9] |
| 3 | 06/09/21 | NSW Health/
Burnett Institute |
“The modelling, which is informed by the
Burnet Institute, shows authorities anticipate a surge in hospitalisation
numbers until at least mid-October, with 2,200 to 3,900 people expected to
require hospital admission.”
“The modelling also estimates peak demand for ICU beds will be around 560 people, with 177 people currently in intensive care in NSW – 67 of whom require ventilation.”[10] |
| No | Date | Scientist/Institute | Prediction |
| 4 | 13/09/21 | Oz Sage
Kirby Institute – University of New South Wales |
“We estimate about 1890 daily cases in
NSW at the time the first freedoms are granted on October 18th when the
70% adult vaccination target is met.
“The virus outpaces the vaccine, spreading every few days while vaccine immunity takes two months to achieve. This is why vaccination, whilst our ultimate exit strategy, cannot control the current NSW epidemic “In the better scenarios, no further freedoms are granted when 80% is reached, but more people become eligible for those freedoms. In these scenarios code black can be avoided but the stress on ICU and hospital capacity will be roughly double to triple what it is currently. If restrictions are relaxed further in November following the 80% target being met, NSW would face code black conditions for five weeks. In all scenarios, once restrictions are relaxed in October, a second, larger peak will occur around Christmas day. If restrictions are only relaxed in November when the 80% target is reached, the second peak occurs in January.” “All scenarios where restrictions are relaxed in October will result in the worst epidemic to date occurring around December 24-26th. The current discussions about “the peak” refer to an epidemic peak under current restrictions – NSW faces a second, larger peak under all scenarios where restrictions are relaxed.”[11] |
| 5 | 24/09/21 | Burnet Institute | “That modelling - conducted by the Burnet Institute -
predicted cases would peak at a seven-day average of about 1500 in September,
and more than 550 COVID-positive patients will require an intensive care bed
by early November.
“It showed hospitalisations across the state - with COVID-19 or otherwise - would likely peak in late October, with about 3400 people admitted in one week.”[12] |
| 6 | 5/10/2021 | Burnet Institute | “Nevertheless, we can see that with
perfect compliance and only double vaccinated people going to Stage 2, the
95th percentile (or the upper part of the band) does not track up. But it
does go up with everyone, including unvaccinated people, going to Stage 2
where there is a risk of a dramatic increase in case numbers.”
“Our modelling results suggest the NSW Government … should have confidence that opening up will be ‘okay’. “But as we’ve all learnt throughout this pandemic, we have to be flexible, so governments must also be prepared to take a pause or even retreat if case numbers kick up and look like they may crash through 2000 cases per day.”[13] |
| No | Date | Scientist/Institute | Prediction |
| 7 | 08/10/21 | University of Sydney Centre of Complex Systems | “The centre’s Dr Sheryl Chang and her
team’s modelling predicted Australia could experience a similar skyrocketing
of cases that happened in Singapore and Israel despite both nations having a
heavily vaccinated population.
“Our modelling suggests that new daily cases are likely to surge if we abruptly exit lockdown, reaching tens of thousands of cases per day across Australia by Christmas even with continued testing, tracing, isolation, quarantine and international travel restrictions,” Dr Chang said. “These post-lockdown surges have already been observed in many countries, even with relatively high vaccine coverage, such as Singapore.”[14] |
| 8 | 11/10/21 | University of Melbourne | “Coronavirus cases will rise as NSW leaves lockdown,
but epidemiologists are optimistic the state’s hospitals can handle a
so-called exit wave of infections.
“Professor Blakely said the effects of lockdown easing will be visible in two to three weeks. He said if cases then began tracking up, authorities would have to mull how much further infections will increase and if the system can cope.” “With summer around the corner, Professor Blakely said Australia’s eastern states will want case numbers “well under control” by mid-December, with Christmas and New Year’s having the potential to be super-spreader events.” [15] |
| 9 | 11/10/21 | Burnet Institute | “Burnet Institute epidemiologist Mike Toole said national and NSW modelling predicted a significant increase in cases once they reopened.”[16] |
| 10 | 11/10/21 | University of New South Wales | “Mary-Louise McLaws, an epidemiologist at the University of NSW, said clusters of infection will begin moving out of Sydney into the state’s regions.”[17] |
| 11 | 12/10/21 | NSW Government/Burnet Institute | “The number of hospitalisations is currently significantly less than the peak predicted in modelling. NSW government modelling indicated that there would be 3434 hospitalisations by late October and 560 people with Covid-19 in ICU. Burnet Institute modelling predicted peak hospital demand of between 2286 and 4016 cases.”[18] |
| No | Date | Scientist/Institute | Prediction |
| 12 | 19/10/21 | Professor Catherine Bennett | “NSW residents have been enjoying weeks
of falling Covid-19 cases and were yesterday granted even more freedoms after
the 80 per cent vaccination goal was reached.
However, an infectious disease expert has warned NSW’s days of low cases are numbered. Deakin University epidemiologist, Catherine Bennett, said maintaining the fall in infections was “not possible” now that restrictions were easing. “As the vaccination rate rises, that’s giving the population at maximum protection right now, but if you think we will go to zero, you’ll be disappointed,” she told ABC.[19] |
| 13 | 19/10/21 | Dr Kerry Chant
NSW Health |
"There are a lot of uncertainties about what
case numbers will do. We would believe they would go up, as we have more
interactions. But as I said, it is in the hands of everyone".
"So, the more people who continue to get tested, the more people followed a public health advice, the more people that get vaccinated, all give us protections," she stated at Tuesday health press conference. "So, we have, to some extent, all of the modelling depends on judging what testing levels are, what the vaccination levels are, what the number of interactions people have. “But we are expecting it does take a lag. So, we would not be expecting numbers to rise within a two-week period, so next week I will be really interested in what our numbers are," she said.[20] |
These statements could not be clearer as to the mainstream scientific epidemiological expectation of what will occur in NSW in the coming 4 – 8 weeks as Christmas and the new year of 2022 approaches.
It is important to note that these statements and forecasts as captured in Table 1 above were made by professional scientists in the full knowledge that NSW:
- has very high and rising rates of COVID-19 vaccine coverage; and
- will experience warmer weather as the spring season (i.e., September-October 2021) turns into summer (i.e., December 2021 – January 2022).
No Structural Break in first 9 days in NSW’s COVID-19 Cases, Hospitalisation and ICU Data
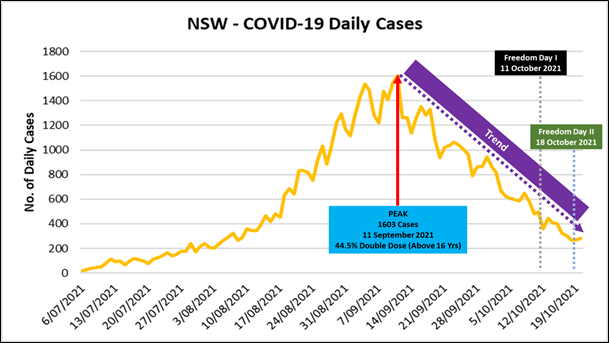
Importantly, and perhaps to the surprise of many conventional observers, NSW has experienced a sustained fall in COVID-19 related cases, hospitalisation and ICU admissions, consistent with the trend patterns first established in mid-September 2021, in the first full nine days since the first major relaxation of COVID-19 lockdown restrictions which occurred on 11 October 2021.
This can be demonstrated in Diagram 1 which graphically represents the count of daily new COVID‑19 infections as per official NSW Government data as published daily by NSW Health.
Diagram 1: COVID-19 Daily Cases in New South Wales as of 8pm, Tuesday, 19 October 2021
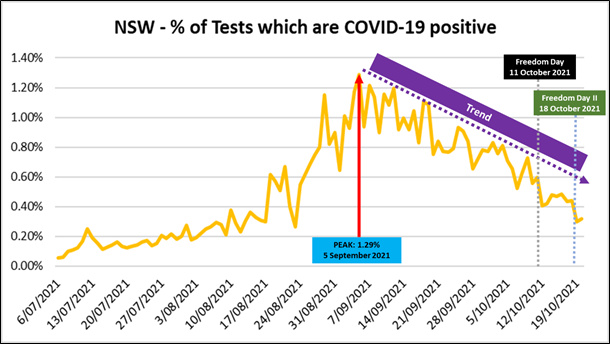
This phenomenon is also true when accounting for fluctuations in daily testing rates as illustrated in Diagram 2.
Diagram 2: Rate of positive COVID-19 tests in New South Wales as of 8pm, Tuesday, 19 October 2021
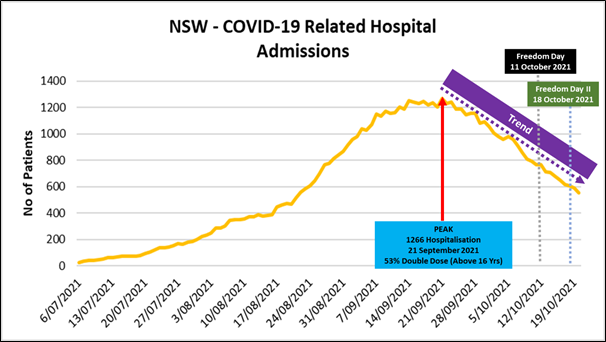
Moreover, this phenomenon is also true for COVID-19 related hospitalisation in NSW as illustrated in Diagram 3 as well as ICU admissions as illustrated in Diagram 4.
Diagram 3 specifically shows that there are fewer citizens in NSW hospitals as a result of COVID-19 from the peak of 1266 hospital admissions which was reached on 21 September 2021. Alternatively, Diagram 4 shows that COVID-19 related ICU admissions have continued to decline from the peak of 244 which was reached on the same day as peak hospitalisation on 21 September 2021.
Diagram 3: COVID-19 related hospitalisation in New South Wales as of 8pm, Tuesday, 19 October 2021

Diagram 4: COVID-19 related ICU Admissions in New South Wales as of 8pm, Tuesday, 19 October 2021
Debunking Conventional Analysis
What is clear from these graphs above and the official NSW Government data which underpins them is that a whole host of forecasts and statements that suggested high rates of hospitalisation and ICU admissions for October 2021 to date have been dead wrong.
Additional time, in the order of several weeks, is required to assess whether other scientific and epidemiological analyses, forecasts and statements that have been made to date for the period of November – December 2021 are accurate and if not, why not.
Importantly as warned above, university academics have already offered alternative rationales for why epidemiological forecasts made for October 2021 have been demonstrably inaccurate.
For example, Professor Jamie Triccas and Dr Megan Steain from the University of Sydney[21] on 14 October 2021 offered two specific rationales for why epidemiological forecasts have been wrong to date including:
- an underestimation of vaccine effectiveness citing recent studies that AstraZeneca and Pfizer offer protection between 94% - 96%; and
- protection in ‘real time’ meaning that rapid take-up in NSW “ensured there was a large proportion of recent vaccines within the population” – meaning that NSW during the period of July – October 2021 did not experience “waning vaccine immunity”.
Unfortunately, these justifications appear to be untested assertions which do not have any clinical or epidemiological evidence to support them. Moreover, these rationales do not consider the possibility that the assumed underlying infection model may be completely wrong.
Conclusion
Current developments in NSW carry a critically important message – that real world science carries real world consequences.
From June 2021 to October 2021, the NSW Government implemented some of the most extreme and extraordinary public health measures in Australian history in order to mitigate the public health risk posed by the Delta variant of COVID-19.
The majority of Australia’s scientific experts are now on the public record making extraordinary forecasts as to what would and will happen in NSW as the state emerges from lockdown. Their forecasts are based on a series of elementary epidemiological assumptions, central among them is that COVID-19 transmits primarily through a P-P infection model.
Dramatic and demonstrable deviations from their centralised forecasts cannot be explained away by the current COVID-19 vaccination campaign, given that international evidence from countries such as Israel and Singapore exist and shows that countries with 80% double dose vaccination rates experienced dramatic explosions in daily COVID-19 cases and related hospitalisation of patients.
Importantly, official COVID-19 related data in NSW nine days after the first relaxation of lockdown restrictions has not seen a structural break in NSW’s official health data reflecting an explosion in daily cases, hospitalisation and ICU admissions.
Rather, the existing declining trend which commenced in mid-September 2021 has continued unabated.
Scientists, policy makers and concerned citizens are now closely waiting whether the underlying science which underpinned totalitarian pandemic management was based on sound or flawed and misguided science.
The implications for the long-term credibility of Australia’s scientific community cannot be overstated.
John Adams is the Chief Economist for As Good As Gold Australia
[1]https://www.adamseconomics.com/post/australia-s-greatest-public-policy-disaster-since-1915
[2] Importantly, as noted in the article “Australia’s greatest public policy disaster since 1915” (see footnote 2), miasma has a long tradition in European epidemiological and medical thinking. This is also true in Chinese epidemiology has noted by Ted Steele – see following link:
https://www.youtube.com/watch?v=Ijc4mjiIquk
[3]See Hoyle F., and Wickramasinghe C., (1979), “Diseases from Space”, J.M. Dent and Sons Ltd, United Kingdom
[4] https://www.abc.net.au/news/2021-09-20/nsw-records-935-covid-19-infections-and-four-deaths/100475524
[5] See the following video via the following link between time stamps – 1 minute 13 seconds to 1 minute 45 seconds, 14 minutes 50 seconds to 15 minutes 7 seconds and 18 minutes to 20 minutes and 20 seconds: https://www.youtube.com/watch?v=nHIDZ2SDM9U
[6] See the following video via the following link between the 13 minutes 50 seconds to 14 minutes 50 second time stamp: https://www.youtube.com/watch?v=eyPLKYs8nJ8
[7]See the following video via the link between 13 minutes to the 14 minutes 9 seconds time stamp on: https://www.youtube.com/watch?v=ZCWe1bN0QXo&t=813s
[8]https://www.themandarin.com.au/163308-modelling-indicates-more-sydney-siders-should-keep-their-distance-to-control-covid-19/
[9]https://www.skynews.com.au/australia-news/coronavirus/nsw-government-modelling-suggests-covid19-hospitalisations-to-peak-at-over-3400-in-october/news-story/b282074caa6d1c5b23648be90e099acb
[10]https://www.theguardian.com/australia-news/2021/sep/06/nsw-covid-cases-could-peak-at-2000-a-day-premier-says-as-state-records-1281-infections-and-five-deaths
[11]https://ozsage.org/media_releases/modelling-of-nsw-roadmap-to-freedom-icu-capacity-for-the-delta-epidemic-2021/
[12]https://7news.com.au/lifestyle/health-wellbeing/new-south-wales-modelling-shows-hospitalisations-could-be-double-initial-predictions-c-4052706
[13]https://pursuit.unimelb.edu.au/articles/nsw-should-be-okay-opening-up
[14]https://www.theaustralian.com.au/breaking-news/covid19-nsw-university-of-sydney-modelling-claims-state-could-hit-40000-cases-a-day-without-restrictions/news-story/45bccf3d6c5836212c55f142a3b083f9
[15] https://www.afr.com/policy/health-and-education/cases-will-rise-as-nsw-opens-the-question-is-by-how-much-20211011-p58yyx
[16] See Footnote 8
[17] See Footnote 8
[18]https://www.theaustralian.com.au/science/modelling-gets-nsw-covid19-hospitalisations-peak-wrong/news-story/628d9c06e9e205384d1dd66dbb8bbdb4
[19]https://www.news.com.au/world/coronavirus/australia/australia-covid-news-live-cases-new-freedoms-and-vaccinations/news-story/3b779a08723519d5364b570fd8126e69
[20]https://www.triplem.com.au/story/nsw-cases-dip-amid-covid-uncertainty-as-the-state-reopens-188569
[21] https://theconversation.com/why-sydneys-covid-numbers-didnt-get-as-bad-as-the-modelling-suggested-169368